 DNA methylation
 MicroRNA
 Microbiome
 Proteomics
 Metabolomics
Summary information of the differential expression analysis dataset is displayed below.
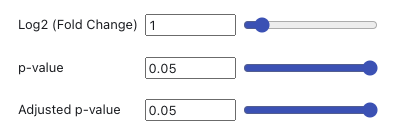
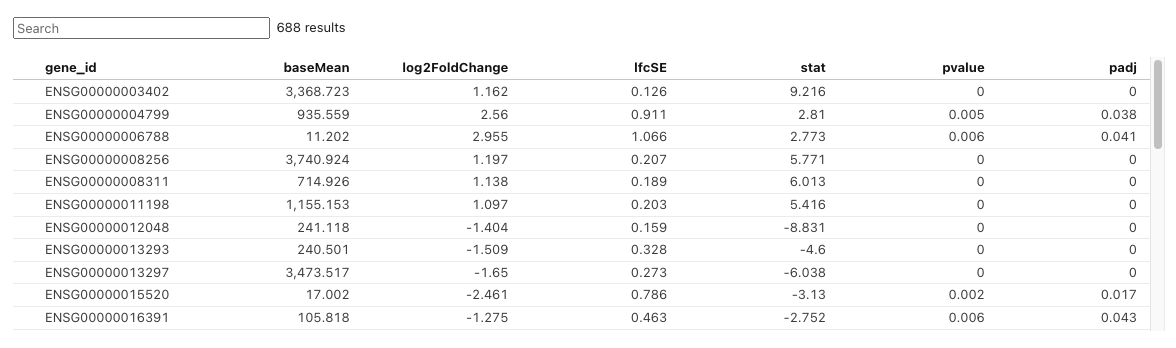
The table below displays a list of differentially expressed genes (DEGs) filtered according to user-defined criteria. Users can set cutoff values for log2FoldChange, p-value, and adjusted p-value using the slicers below. The log2FoldChange cutoff is defined as the absolute value.
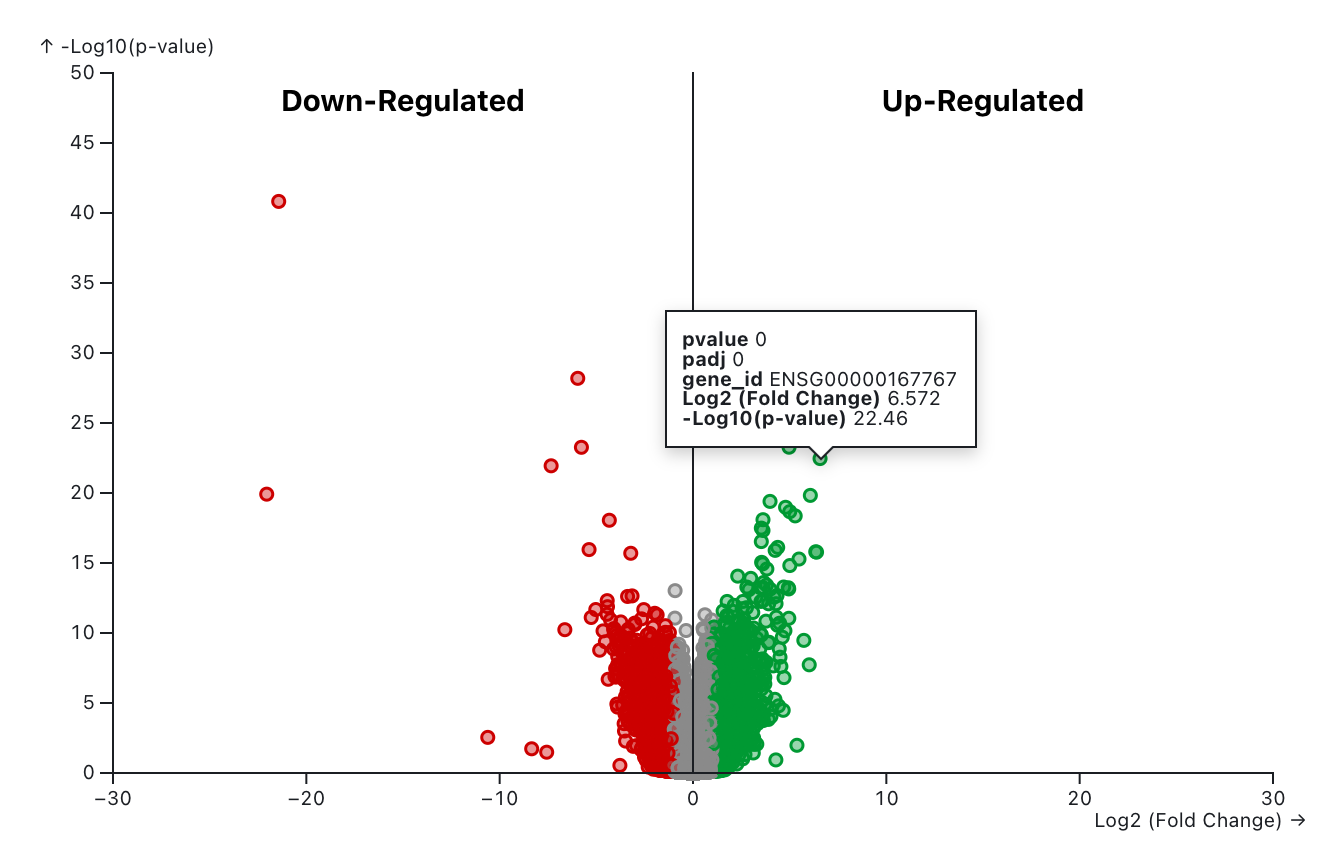
The volcano plot displays statistical significance (-log10 P value) versus magnitude of change (log2 fold change) and is useful for visualizing differentially expressed genes. Highlighted genes are significantly differentially expressed at the selected cutoff values. Red color denotes the down-regulated genes and green color denotes the up-regulated genes. Genes filtered out based on the cutoff values were denoted as “None” with gray color. Users can set cutoff values for log2FoldChange, p-value, and adjusted p-value using the slicers below. The log2FoldChange cutoff is defined as the absolute value.
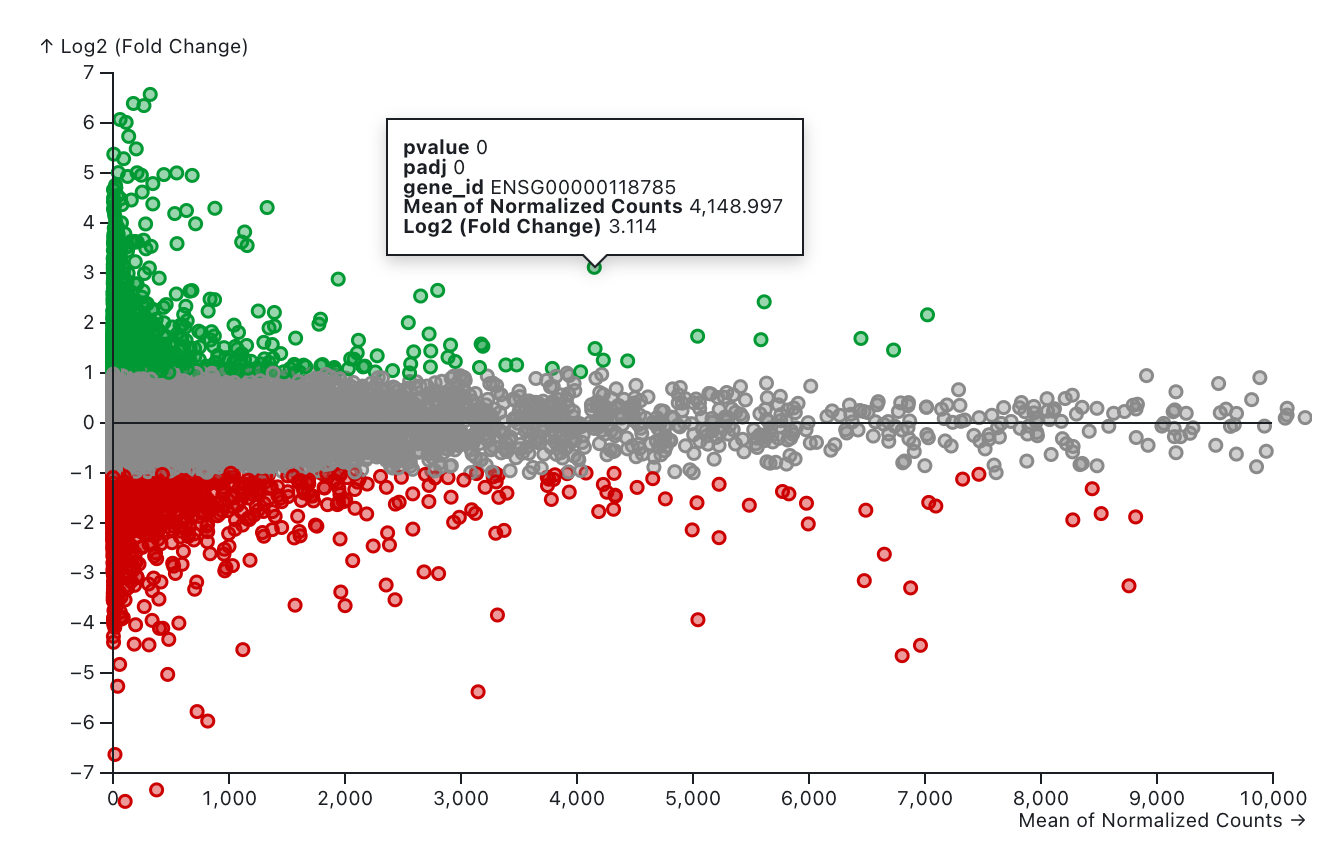
The MA plot displays the log2 fold changes for a given variable against the mean of normalized counts across all samples in the differential expression analysis. Red indicates down-regulated genes, while green represents up-regulated genes. Genes filtered out based on the selected cutoff values are shown in gray and labeled as "None." Users can adjust the cutoff values for log2FoldChange, p-value, and adjusted p-value using the slicers below. The log2FoldChange cutoff is defined by its absolute value.
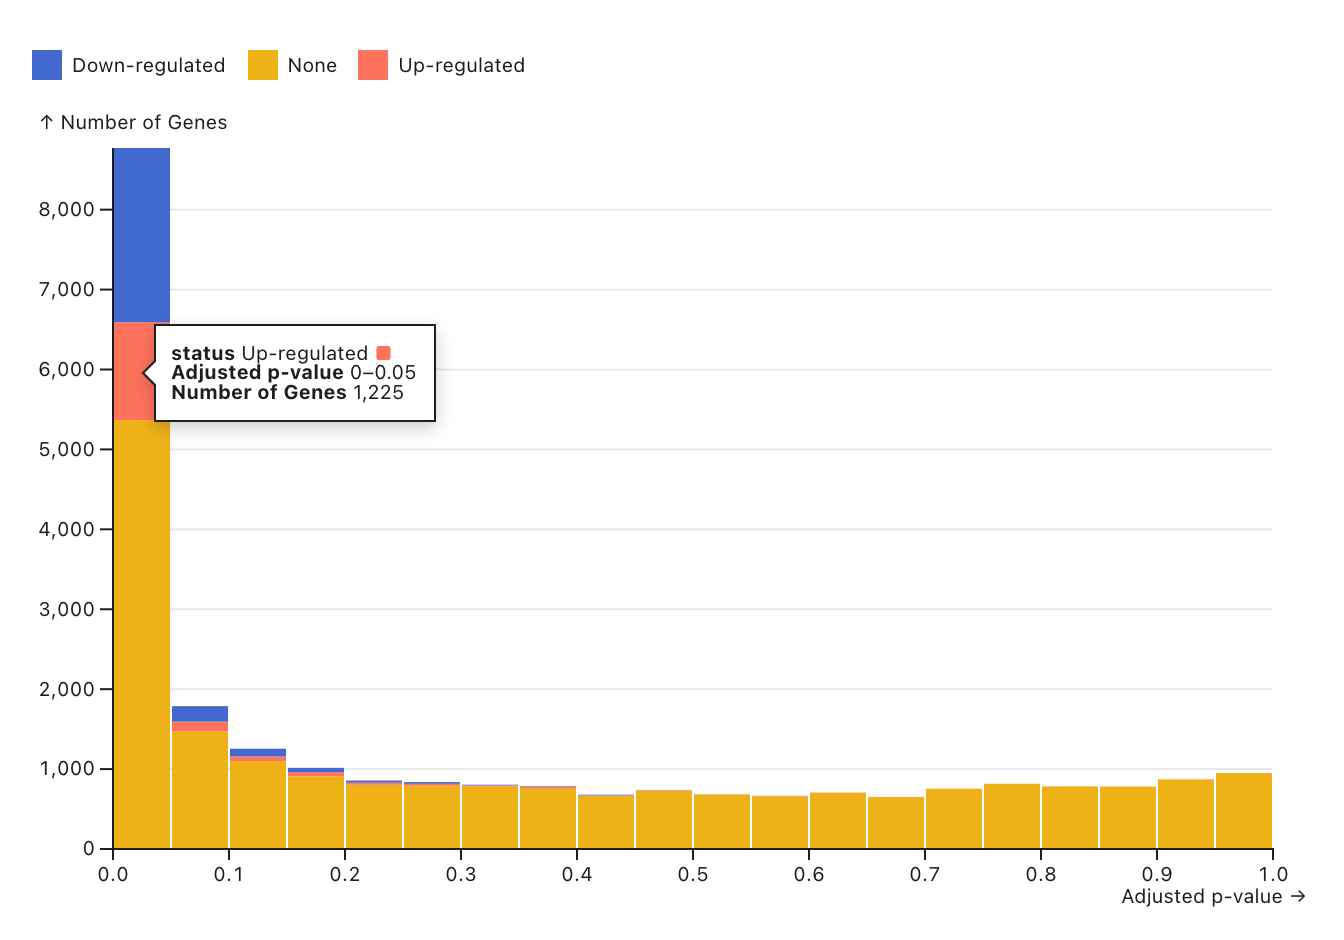
The histogram below shows the distribution of adjusted p-values in the analysis results. It allows users to explore the number of statistically significant differentially expressed genes (DEGs) based on their regulation status. Blue bars represent down-regulated genes, while red bars represent up-regulated genes. Genes filtered out by the selected cutoff values are shown in orange and labeled as "None." Users can adjust the cutoff values for log2FoldChange, p-value, and adjusted p-value using the slicers below. The log2FoldChange cutoff is defined by its absolute value.
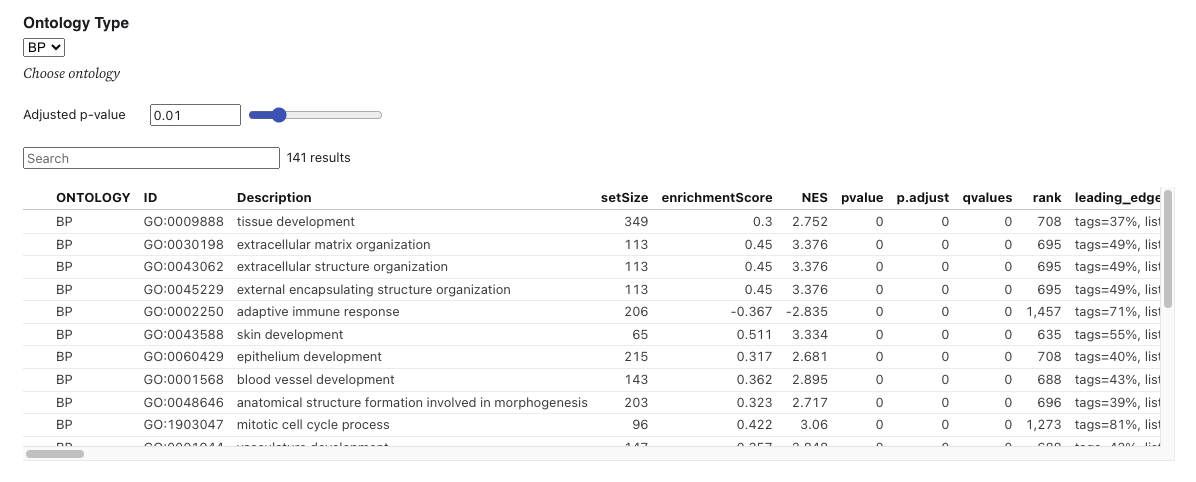
The table below presents the gene set enrichment analysis (GSEA) results using gene ontology, based on the identified differentially expressed genes (DEGs). It includes several summary and statistical values. For the GSEA, the R package clusterProfiler [1] was used with the gseGO function, applying a p-value cutoff of 0.05. R package org.Hs.eg.db [2] was used for gene annotation. The default criteria for DEG identification are set to an absolute log2FoldChange of 1 and an adjusted p-value of 0.05. Users can modify the DEG criteria by adjusting the slicers below and pressing "RERUN."
Users can select one of three orthogonal ontologies : 1) biological process (BP), 2) cellular component (CC), and 3) molecular function (MF).
[1] Xu S, Hu E, Cai Y, Xie Z, Luo X, Zhan L, Tang W, Wang Q, Liu B, Wang R, Xie W, Wu T, Xie L, Yu G (2024). “Using clusterProfiler to characterize multiomics data.” Nature Protocols. ISSN 1750-2799, doi:10.1038/s41596-024-01020-z, https://www.nature.com/articles/s41596-024-01020-z.
[2] Carlson M (2019). org.Hs.eg.db: Genome wide annotation for Human. R package version 3.8.2.
Cut-off criteria for DEG identification
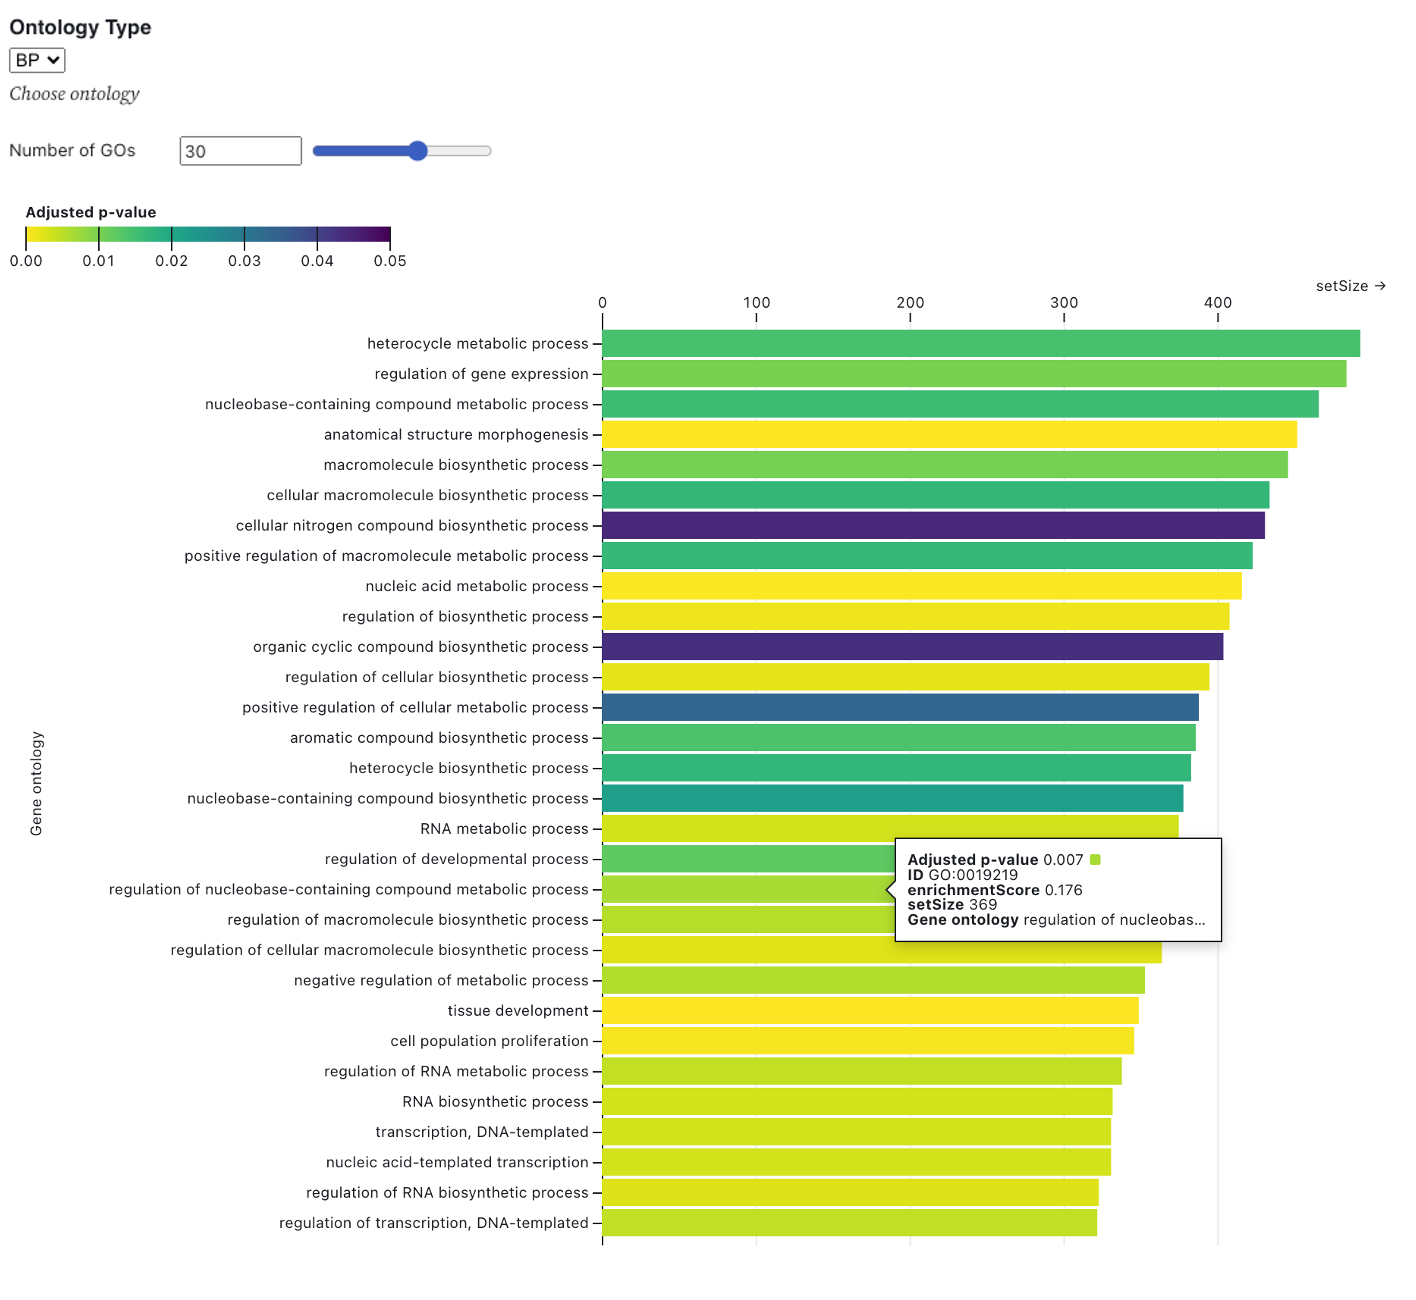
The bar plot below displays the gene set enrichment analysis (GSEA) results using gene ontology, based on the identified differentially expressed genes (DEGs). The y-axis represents the gene ontology terms, while the x-axis shows the gene set size. The bars are colored according to the adjusted p-value of each ontology and are ordered by gene set size. For the GSEA, the R package clusterProfiler [1] was used with the gseGO function, applying a p-value cutoff of 0.05. R package org.Hs.eg.db [2] was used for gene annotation. The default criteria for DEG identification are set to an absolute log2FoldChange of 1 and an adjusted p-value of 0.05. Users can modify the DEG criteria by adjusting the slicers below and pressing "RERUN."
Users can select the number of GOs using slicer and one of three orthogonal ontologies : 1) biological process (BP), 2) cellular component (CC), and 3) molecular function (MF).
[1] Xu S, Hu E, Cai Y, Xie Z, Luo X, Zhan L, Tang W, Wang Q, Liu B, Wang R, Xie W, Wu T, Xie L, Yu G (2024). “Using clusterProfiler to characterize multiomics data.” Nature Protocols. ISSN 1750-2799, doi:10.1038/s41596-024-01020-z, https://www.nature.com/articles/s41596-024-01020-z.
[2] Carlson M (2019). org.Hs.eg.db: Genome wide annotation for Human. R package version 3.8.2.
Cut-off criteria for DEG identification